

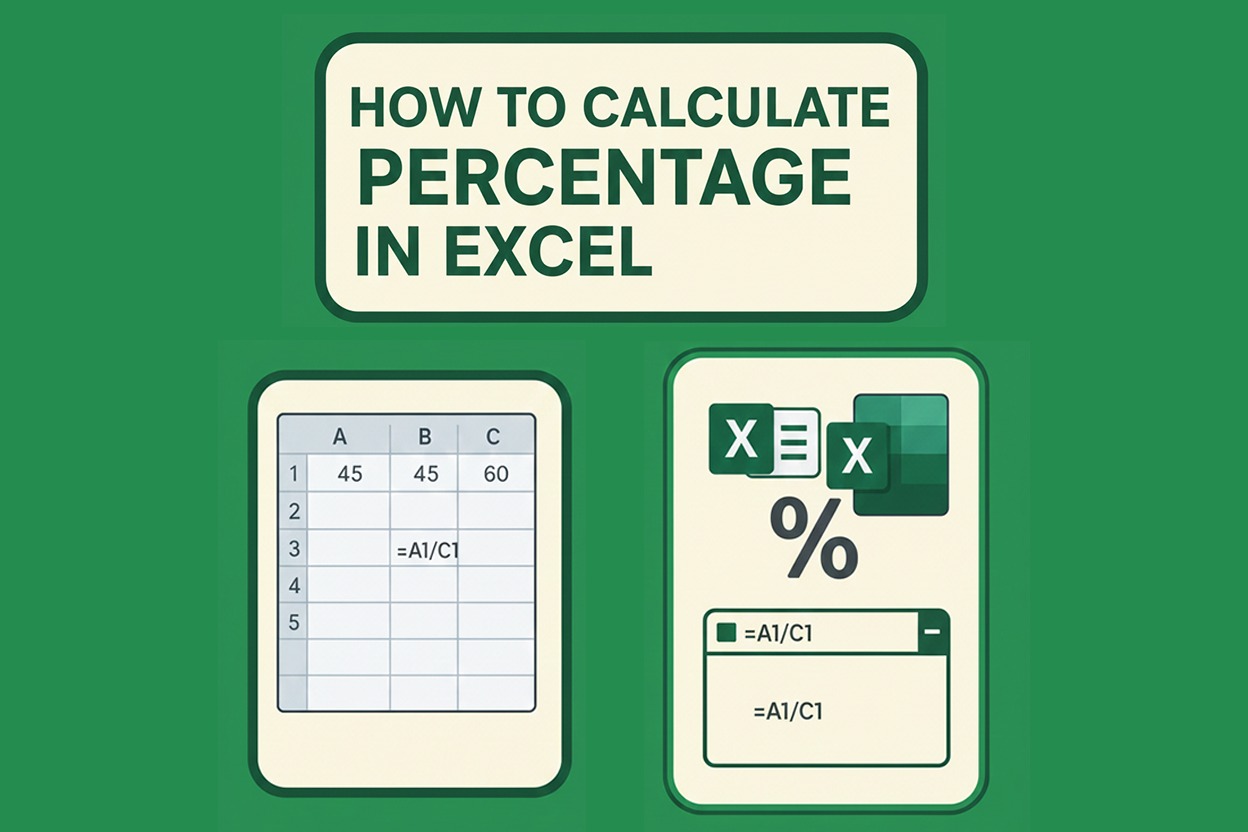
Introduction
- Percentages simply show a value out of 100.
- Excel makes percentage calculations very easy because you can use simple formulas.
- Whether you’re calculating marks, discounts, growth rates, or salary changes, Excel handles it all with a few clicks.
Step 1: Basic Percentage Formula
- The basic percentage formula is:
=Part/Total - After typing the formula, change the cell format to Percentage (%).
- Example:
A student scores 45 out of 60.
Formula → =45/60
Excel shows 0.75, and after formatting → 75%.
Step 2: Using Cell References
- Instead of typing numbers directly, use cell references.
- Example:
- Score is in B2
- Total marks in C2
- Formula → =B2/C2
- Then go to Home → Number → Percentage (%) to format.
Step 3: Calculating Percentage Increase or Decrease
- The formula to find increase or decrease is:
=(New Value – Old Value)/Old Value - Example:
Sales grow from 500 to 600.
Formula → =(600-500)/500 → 0.2 → 20% increase.
Step 4: Apply the Formula to Multiple Rows
- After typing the formula once, drag the Fill Handle (small square at the bottom-right of the cell).
- Excel automatically adjusts the references for each row.
- This is helpful when calculating marks or growth for many students/products.
Step 5: Display Results as Percentages
- Select the result cells → Click the % button in the toolbar.
- To show more detail, increase decimals using:
Home → Increase Decimal ( .00→ )
Step 6: Real-Life Examples of Percentage in Excel
- Exam scores:
Marks obtained ÷ Total marks - Discount:
(Original price – Sale price) ÷ Original price - Profit margin:
(Profit ÷ Cost price) × 100 - Performance growth:
(New value ÷ Old value) – 1
Tips & Best Practices
- Always use cell references instead of typing numbers.
- Avoid blank or text cells in formulas to prevent errors.
- Use Conditional Formatting to highlight high or low percentages for easy analysis.